Indicators
For those who enjoy trading manually and want the ability to decide their entries and exits.From: $30.00 / month
AEP Volumetric Ladder - Bid/Ask & Volume Footprint for NinjaTrader 8
See exactly where the real buying and selling is happening, bar by bar, price by price. The AEP Volumetric Ladder plots a full order-flow footprint directly on your NinjaTrader 8 chart, breaking down every price level inside each bar into the actual contracts traded at the bid versus the ask — no guessing, no estimating.Select options This product has multiple variants. The options may be chosen on the product pageFrom: $30.00 / month with a 30-day free trial
Choose from our Monthly or Lifetime Plans
Want to learn more on how to use your indicators as well as other trading concepts using running charts?Select options This product has multiple variants. The options may be chosen on the product pageFrom: $30.00 / month with a 30-day free trial
The Impulse MACD is a modified MACD that is designed to reduce or filter the ‘noise’ shown on the traditional MACD. The result is a reduction of the back and forth across the zero line or whipsaw effect and the cyclical plotting of the histogram which typical in a ranging or sideways market. This can be very helpful in finding the places where there is no trend and where it might be most advantageous to stay on the sidelines, avoid trading and preserve capital. It’s simple, if you don’t want to trade in a ranging market, don’t trade when the Impulse MACD is flat.
Choose from our Monthly or Lifetime Plans
Want to learn more on how to use your indicators as well as other trading concepts using running charts?Select options This product has multiple variants. The options may be chosen on the product pageFrom: $30.00 / month with a 30-day free trial
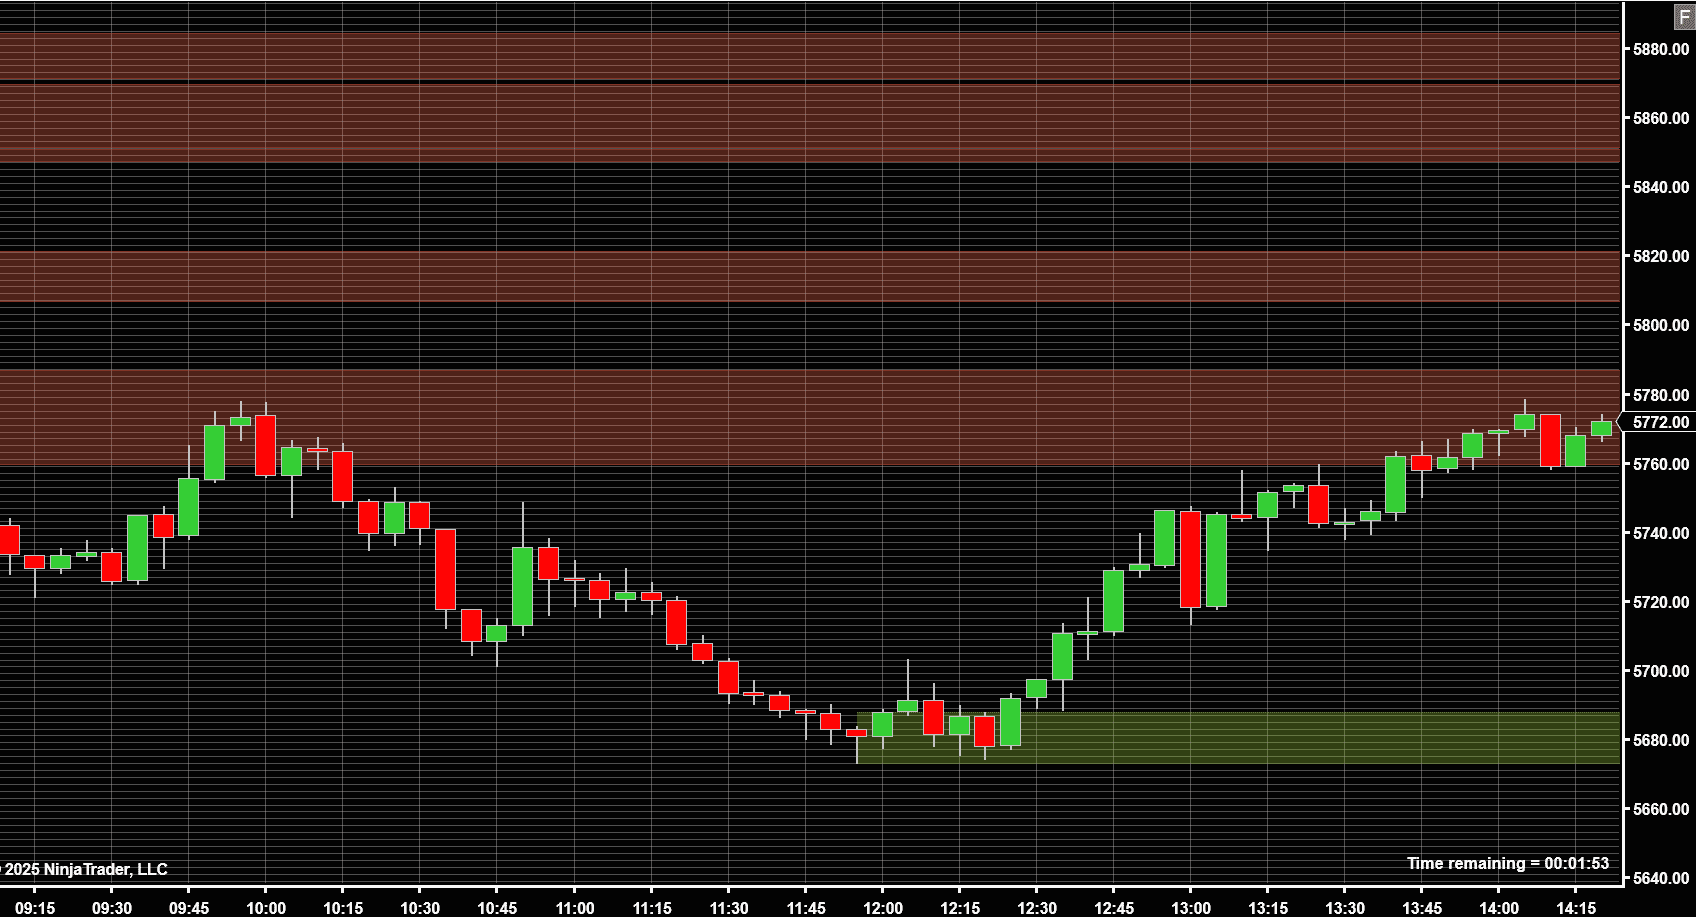
Have you ever wondered why you enter a “fantastic” trade and, right after it starts out heading in your favor, the price reverses sharply and takes your money? You likely hit a supply or demand zone. Institutions and market makers tend to pile up sell orders and buy orders in particular locations and those large numbers of orders are what creates these zones that cause the reversals. Stop losing your hard-earned dollars by converting them into market liquidity for the big players. This Supply and Demand Zone indicator helps you identify just where these zones are IN REAL TIME so that you can better avoid reversals and capitalize on your newfound ability to ride the coat tails of the really big money. Don’t fight the market. Swim in the direction of the really big fish with Supply and Demand. Installation Pro Tip:
- Right click anywhere in your main chart box and bring up the chart menu.
- Select "Data Series" settings.
- Scroll down one section to the "Time Frame" settings group.
- In the "Days To Load" box, change the number to a minimum of 30.
Choose from our Monthly or Lifetime Plans
Want to learn more on how to use your indicators as well as other trading concepts using running charts?Select options This product has multiple variants. The options may be chosen on the product page$89.00
Have you ever taken a trade with fixed money management only to see it stop you out and then go on to fill your target price? The culprit was most likely market volatility, commonly recognized as candle size. AEP's Trade Manager helps to eliminate this by taking market volatility into account and adjusts your fixed money management stop loss and profit target for Ninja ATM's. Available ONLY Through A Lifetime License
Want to learn more on how to use your indicators as well as other trading concepts using running charts?$100.00 / month with a 30-day free trial
The Trend Bundle includes 3 products: Trend Ribbon, Trend Buy / Sell, and Trend Support and Resistance at a discounted rate.
Want to learn more on how to use your indicators as well as other trading concepts using running charts?$50.00 / month with a 30-day free trial
As a companion to Trend Ribbon, we offer the Buy / Sell Signal which functions based on The Trend Ribbon and issues signals for trade entry and exit points based on interpretations of The Trend Ribbon.
Want to learn more on how to use your indicators as well as other trading concepts using running charts?$50.00 / month with a 30-day free trial
A colored ribbon that measures the strength and direction of the current trend. One color of your choice represents an uptrend and a different color of your choice represents a downtrend. The width of the ribbon shows the trend's strength and the transition to a different direction by narrowing the width of the ribbon before the directional shift. Fully adjustable to accommodate your style and time frame of trading, whether intra-day, day trading, swing trading, or longer terms.
Want to learn more on how to use your indicators as well as other trading concepts using running charts?