Anatomy of a Candlestick (Course 1)
January 7, 2026
Anatomy of a Candlestick (Course 3)
January 8, 2026
Anatomy of a Candlestick (Course 2)
Candlesticks are a very important part of trading as they tell a story of the time period which they represent (1 min, 3 min, 5 min, daily). During the active time period of the candlestick, it moves dynamically creating longer wicks, shorter bodies, new highs and lows. At the end of its time period, the candlestick represents the open, close, high, low and real body of price action activity for its period, and is permanently fixed at its conclusion. One candlestick however does not tell the full story of what is happening in the market, each candlestick however forms part of the tapestry of your chart and the trader needs to understand what each candlestick tells them in relation to the other candlesticks to the left in order understand the probability of what might happen on the right of the charts. In order to understand the probabilities, the trader needs to consider candlestick body size, wicks, open and close of candlesticks to piece together the sentiment of the market, is market moving up or down or is the market moving sideways.
To better understand what each element of the candlestick would tell the trader, the candlestick representations below will help and guide traders to better appreciate the nuances in candlesticks.
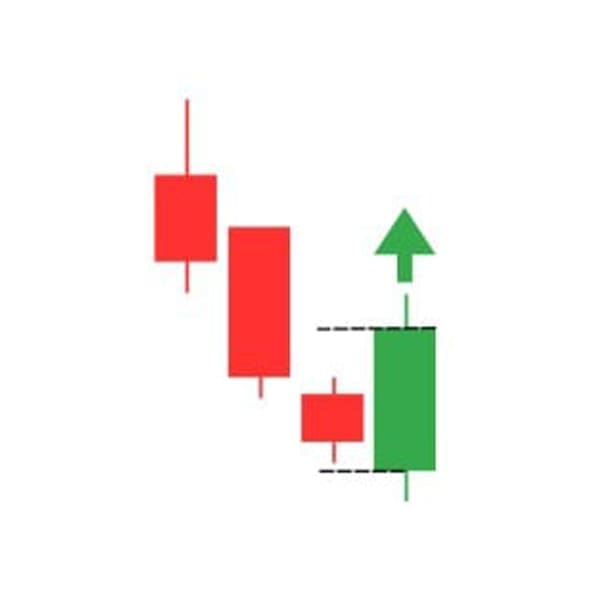
The importance in all candles is to identify the relationship between bodies and wicks which in turn give us information on the intent of price action. Single candlesticks do not give us the full story, so in many cases blending of candlesticks needs to take place to better understand price action (this will be covered in another course module).
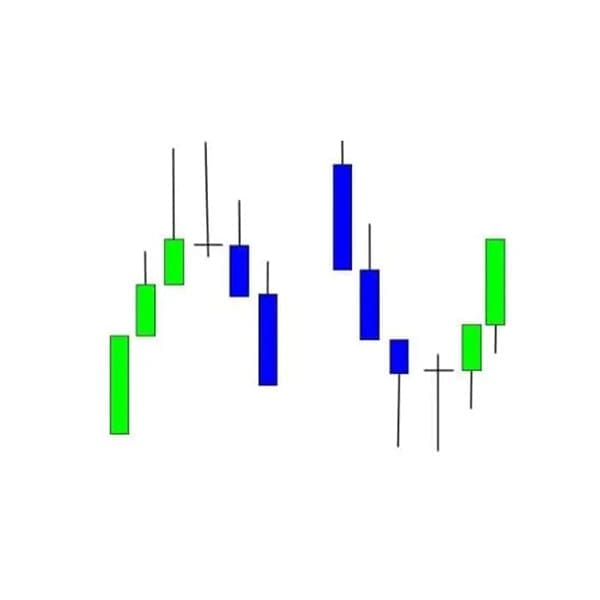
The first goal in understanding the market is to understand the psychology of the Doji and the Pinbar (Indecision). These indecision symbols mainly appear at different key areas in the price action, but not limited to those areas, when price is turning around or when price is moving sideways. The wick gives the clue as what price will likely do after these symbols:

In both the above diagrams the body sizes and wicks are indicating indecision and the probable direction of the future price direction. Pinbars however are stronger indicators than Doji’s given that they show the extra motivation of the price in the opposite direction to the wick rejection. Given the Doji does not have a body it makes it slightly weaker signal than the Pinbar but nonetheless is an extremely powerful indecision symbol.
Spinning Tops and common Doji’s indicate indecision, however are weaker symbols than the Pinbar, long wicked and dragonfly/gravestone Doji’s, due to the wicks being about the same size on either side of the entry. These symbols mainly occur at sideways movements or at price reversals:
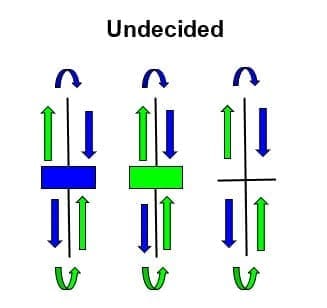
In the case of the Spinning Top the color of the body gives a slight clue but not a strong one as to possible direction of the price action, and traders should consider the wick sizes above and below the body to try reinforce the probable direction. In the case of the common Doji, more candles before and after the Doji should be used to try and identify the probable direction of the price action.